Data catalogs
Data catalogs in Anlytic provide a structured and centralized view of your data. They help improve data visibility, data quality, and overall trust in the information used across your organization. A well-designed catalog makes it easier for users to discover datasets, understand their structure, and select the appropriate data when creating visualizations.
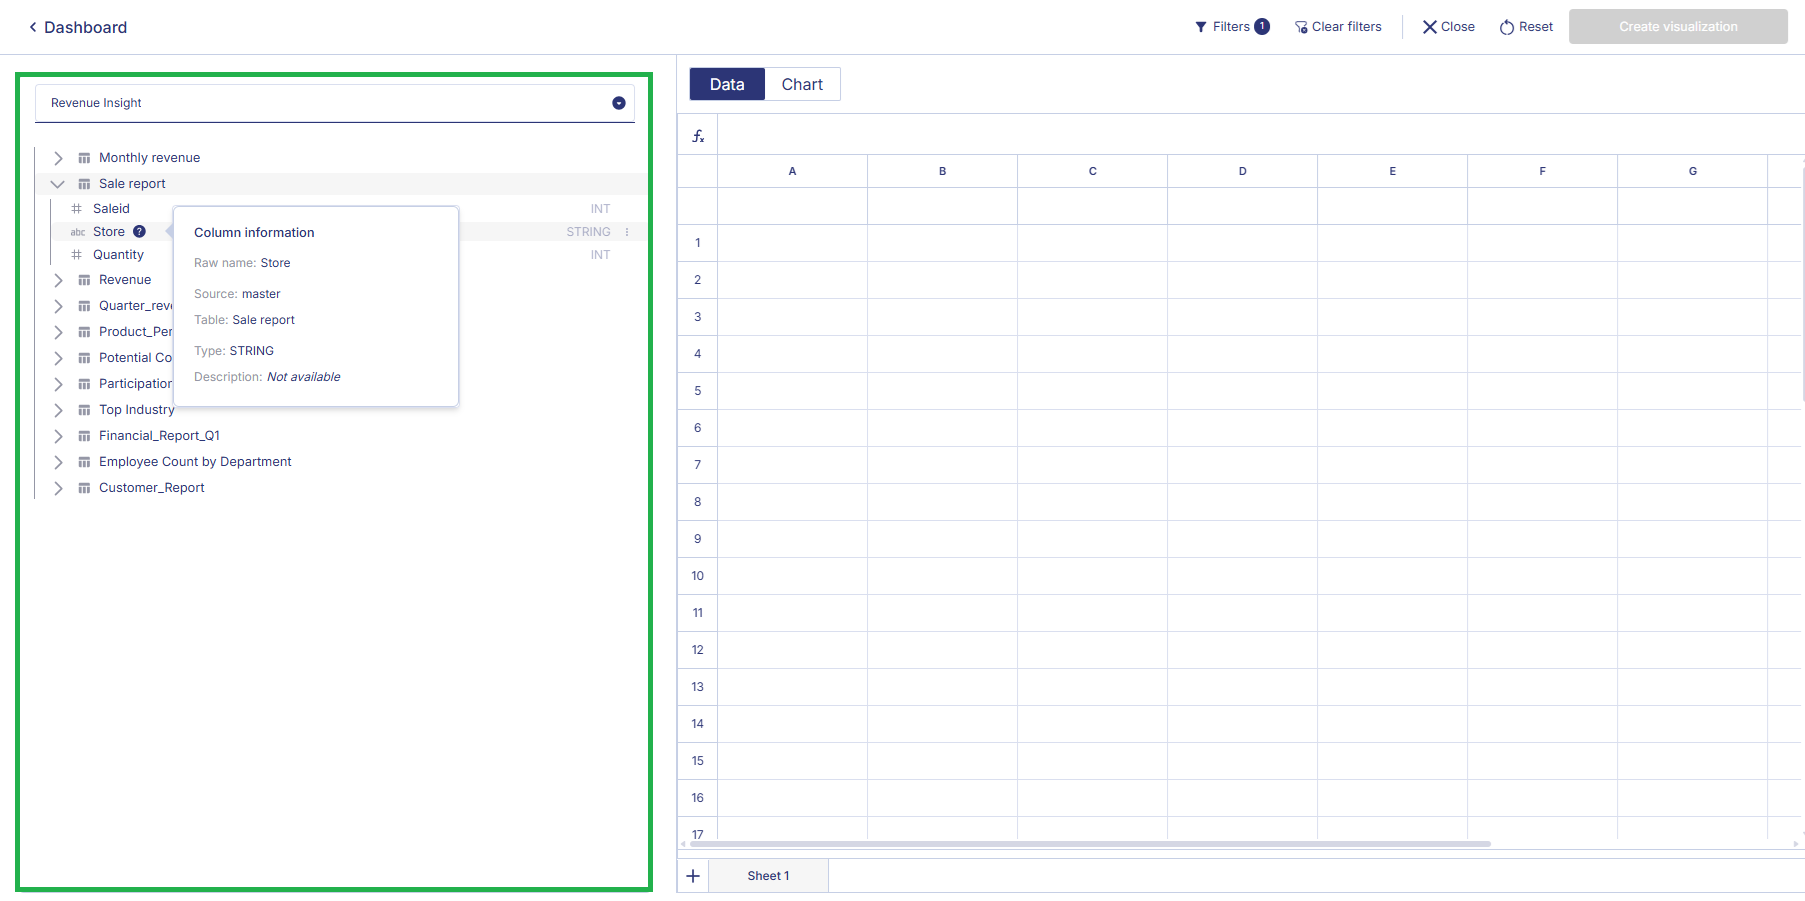
When building a visualization, the catalog appears in the data selection panel. It lists all tables and columns available within the catalog. You can hover over any table or column and place your cursor on the information icon (?) to view additional details such as descriptions or metadata. This allows users to quickly identify the meaning and purpose of each field before using it in a chart.
Last modified on March 13, 2026