In this chapter we are going to walk you through how you can create a pie chart using the Anlytic platform.
Pie charts are useful for highlighting proportions. Whether you’re analyzing market shares, budget allocations, or survey responses, pie charts offer an intuitive way to showcase proportions and percentages within a dataset. With our intuitive drag-and-drop interface, users can effortlessly import their data and generate pie charts in a matter of seconds.
How to create a pie chart?
-
Add a visualization container to your dashboard. Select the option data visualization and click on create. This will take you to the create visualization page.
-
Choose a table from the catalog and double-click the column names you want to use. The selected columns will be added directly into the Data table.
-
Click Chart to configure your visualization. In the General section, set the chart title and description and choose pie chart as the chart type.
-
In the Data section, choose the data sheet and select the Group and Data fields. The Group field determines how the pie chart segments are divided, and the Data field defines the values represented in each segment.
-
In Display Options, choose whether to show labels by turning the Show labels toggle on or off. Select the label position, set the legend position, and adjust colors to define how segments are displayed on the chart. All configuration changes in the Chart tab are reflected immediately in the chart preview.
-
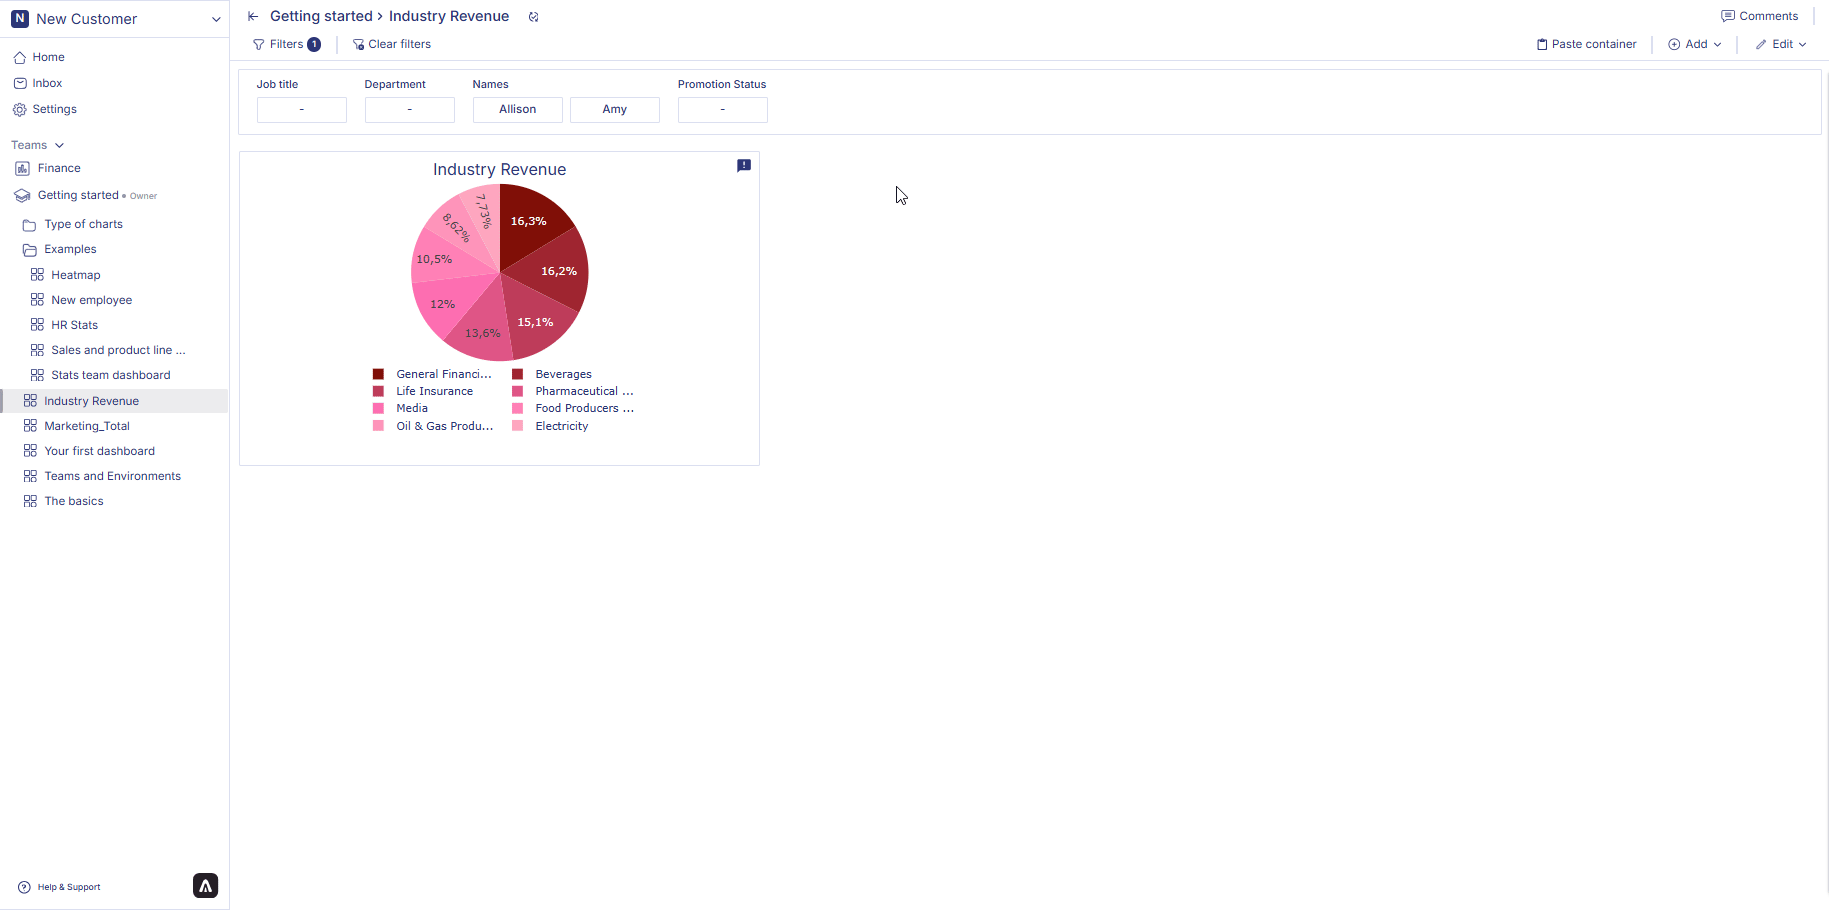
When you finish configuring the chart, click Create visualization in the top-right corner of the page. Your pie chart will be saved and displayed on the dashboard.
How to edit a pie chart?
Follow the steps below to edit pie chart:
-
Hover over a pie chart container from the dashboard. Three dots will appear on the top right hand corner of the chart container. Click on the three dots and an option menu will appear. Click on ‘edit’ from the option menu.
-
After making the chages to the chart, click on change table from the top right corner of the page. Your chart changes is saved and chart is displayed on the dashboard.
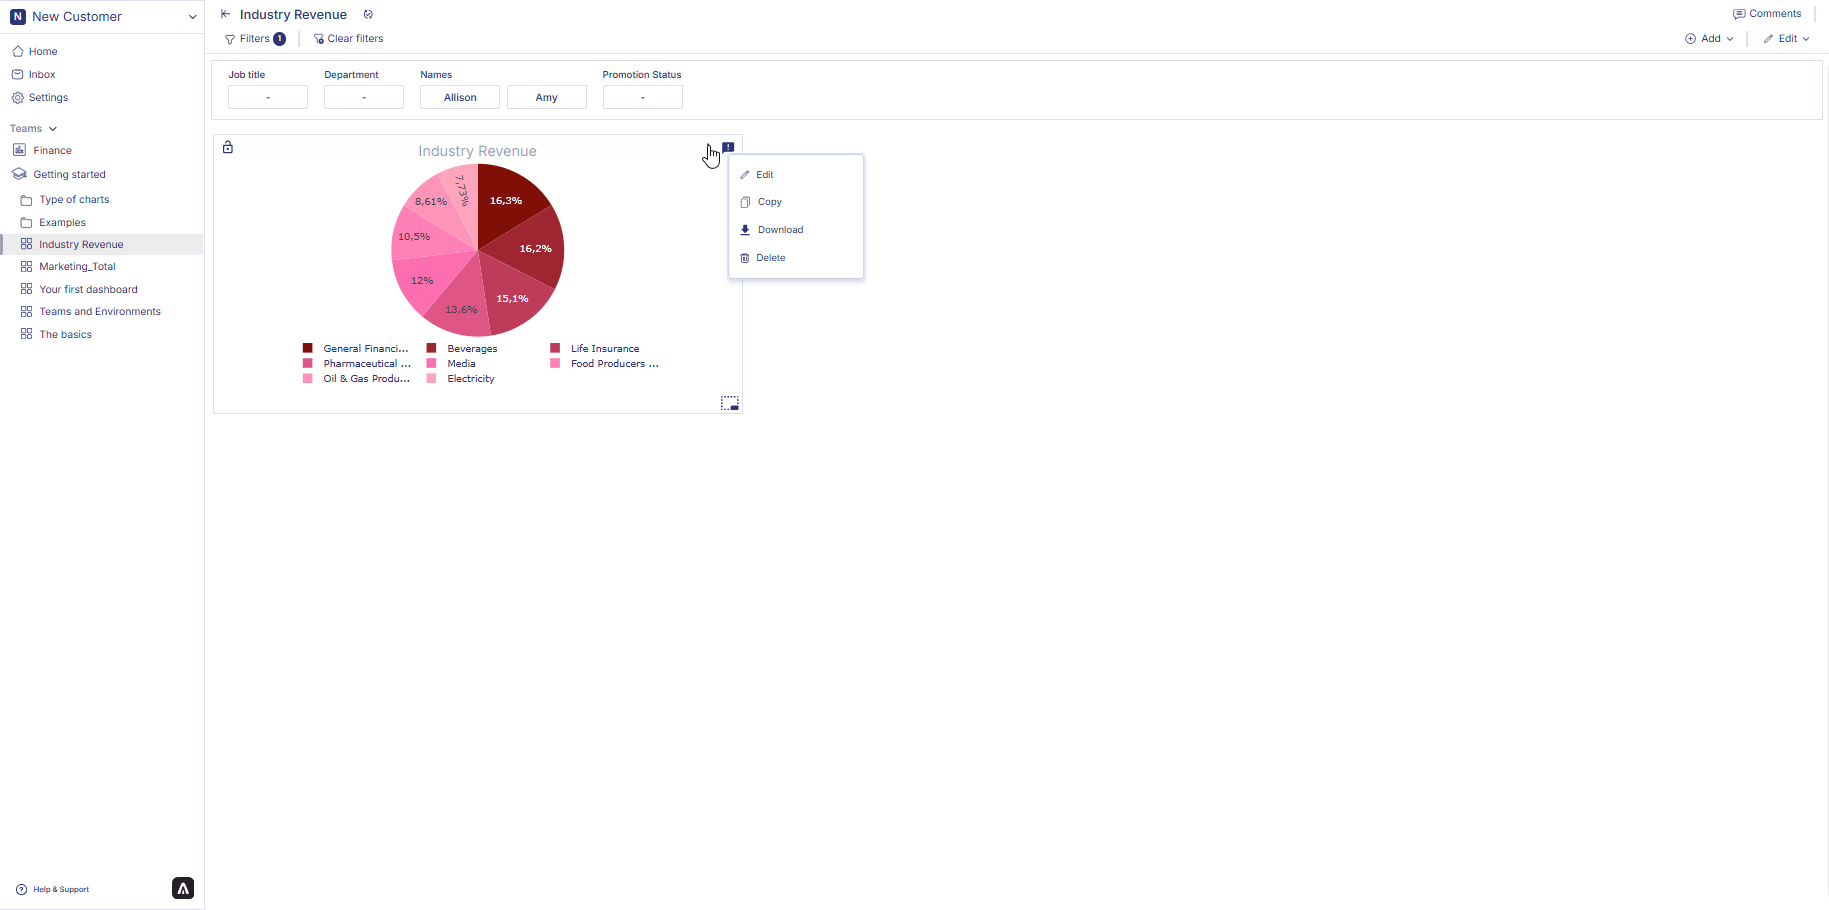
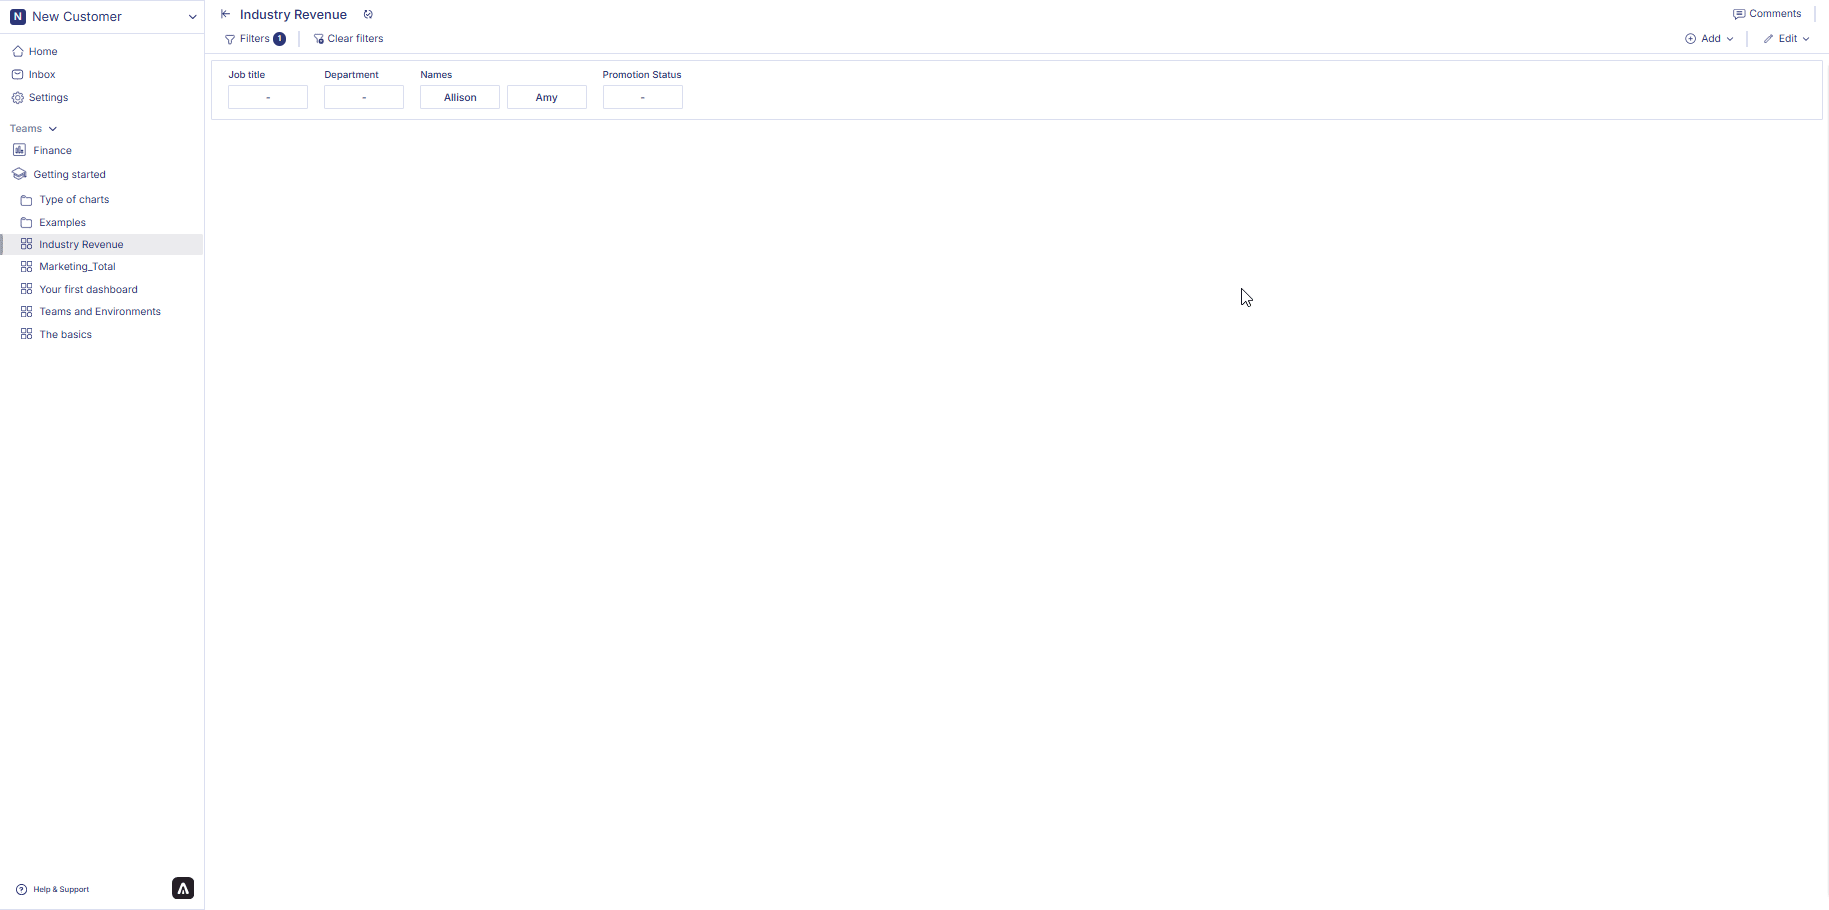
How to delete a pie chart?
Follow the steps below to delete pie chart:
-
Hover over a pie chart container from the dashboard. Three dots will appear on the top right hand corner of the chart container. Click on the three dots and an option menu will appear.
-
Click on ‘delete’ from the option menu. Click on delete to confirm your choice. Your chart is permanently deleted.
 In next page we are going to walk you through how you can create a data table in the Anlytic platform.
 Last modified on March 13, 2026