You can create dashboards under the team environment which are shared dashboards with your team. You can also create a personal dashboard which can only be accessed by you.
New dashboard.
From the homepage, hover over the name of the team where you want to create the dashboard, three dot will appear.
Click on three dots, an option menu will appear. Click on the option add dashboard to create your dashboard. Give a name to your dashboard. Click on add. A dashboard will be added under that team.
Overview to Anlytic Dashboard
In this chapter, we are going to walk you through the Anlytic dashboard and introduce every feature it offers.
The Anlytic dashboard consists of multiple assets that can assist you in creating your report and visualizations for analysis. The dashboard is designed with simplicity and easy usability for the user in mind.
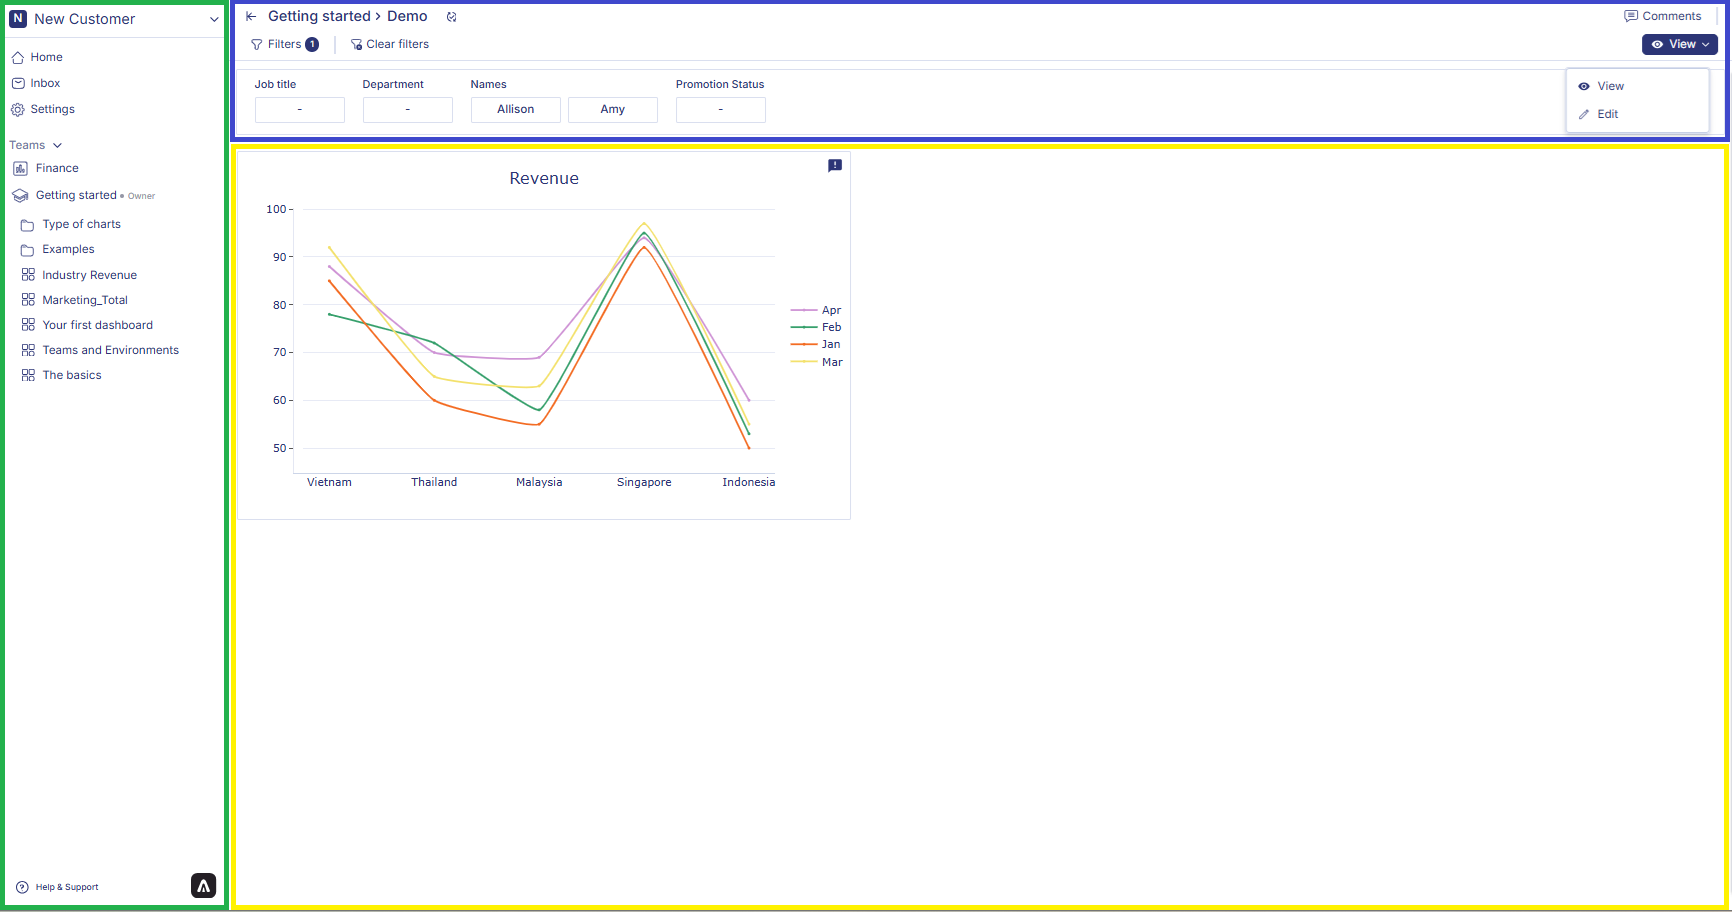 On the left-hand panel marked in green, you can see the name of the workspace, teams environment, personal environment, and the selected dashboard as highlighted.
On the top bar indicated with blue box, you can see the name of the team and name of the Dashboard, when was last cache updated along with changing dashboard mode button. Dashboard modes:
On the left-hand panel marked in green, you can see the name of the workspace, teams environment, personal environment, and the selected dashboard as highlighted.
On the top bar indicated with blue box, you can see the name of the team and name of the Dashboard, when was last cache updated along with changing dashboard mode button. Dashboard modes:
-
View: In view mode you can only view the dashboard and can not make any changes to the dashboard.
-
Edit mode: In edit mode all features are accessible, e.g. adding a chart, editing existing charts, organizing the dashboard.
-
Comments: In comments mode you can leave remarks, ask questions, or provide feedback directly on the dashboard without modifying any charts or layout.
Area within the yellow box is where you can see the visualizations. To create a visualization, you always have to change the mode from view to edit. In order to create the first visualizaion on a dashboard, you always have to first add a row to the dashboard. Once you create a row, you can see the icon to add a visualizaion container to your dashboard, Icon to edit the row name, icon to copy the row and icon to delete the row.
Now that you have got an overview of the dashboard elements, in the next page we are going to learn how you can create a dashboard. Last modified on March 13, 2026