> ## Documentation Index
> Fetch the complete documentation index at: https://docs.anlytic.com/llms.txt
> Use this file to discover all available pages before exploring further.
# Building workbooks
A workbook is where you prepare your dataset, apply transformations, and build visualizations using Graphbuilder.\
This chapter walks you through creating a workbook, adding data, and shaping your dataset for analysis.
Before building a workbook, make sure you have already [connected a data source](../data/connectors/create), [added metadata](../data/meta/create), [defined relationships](../data/relationships/create), and [created a catalog](../data/catalogs/create).
## 1. Create a Workbook
### 1.1 Opening a Workbook
A workbook opens automatically when creating a visualization.
1. Open a **dashboard**.
2. Switch to **Edit mode**.
3. Click **Add row** → enter a title → click **Add**.
4. Click **Add visualization** → select **Data visualization**.
5. Click **Create** to launch the Workbook + Data Builder.
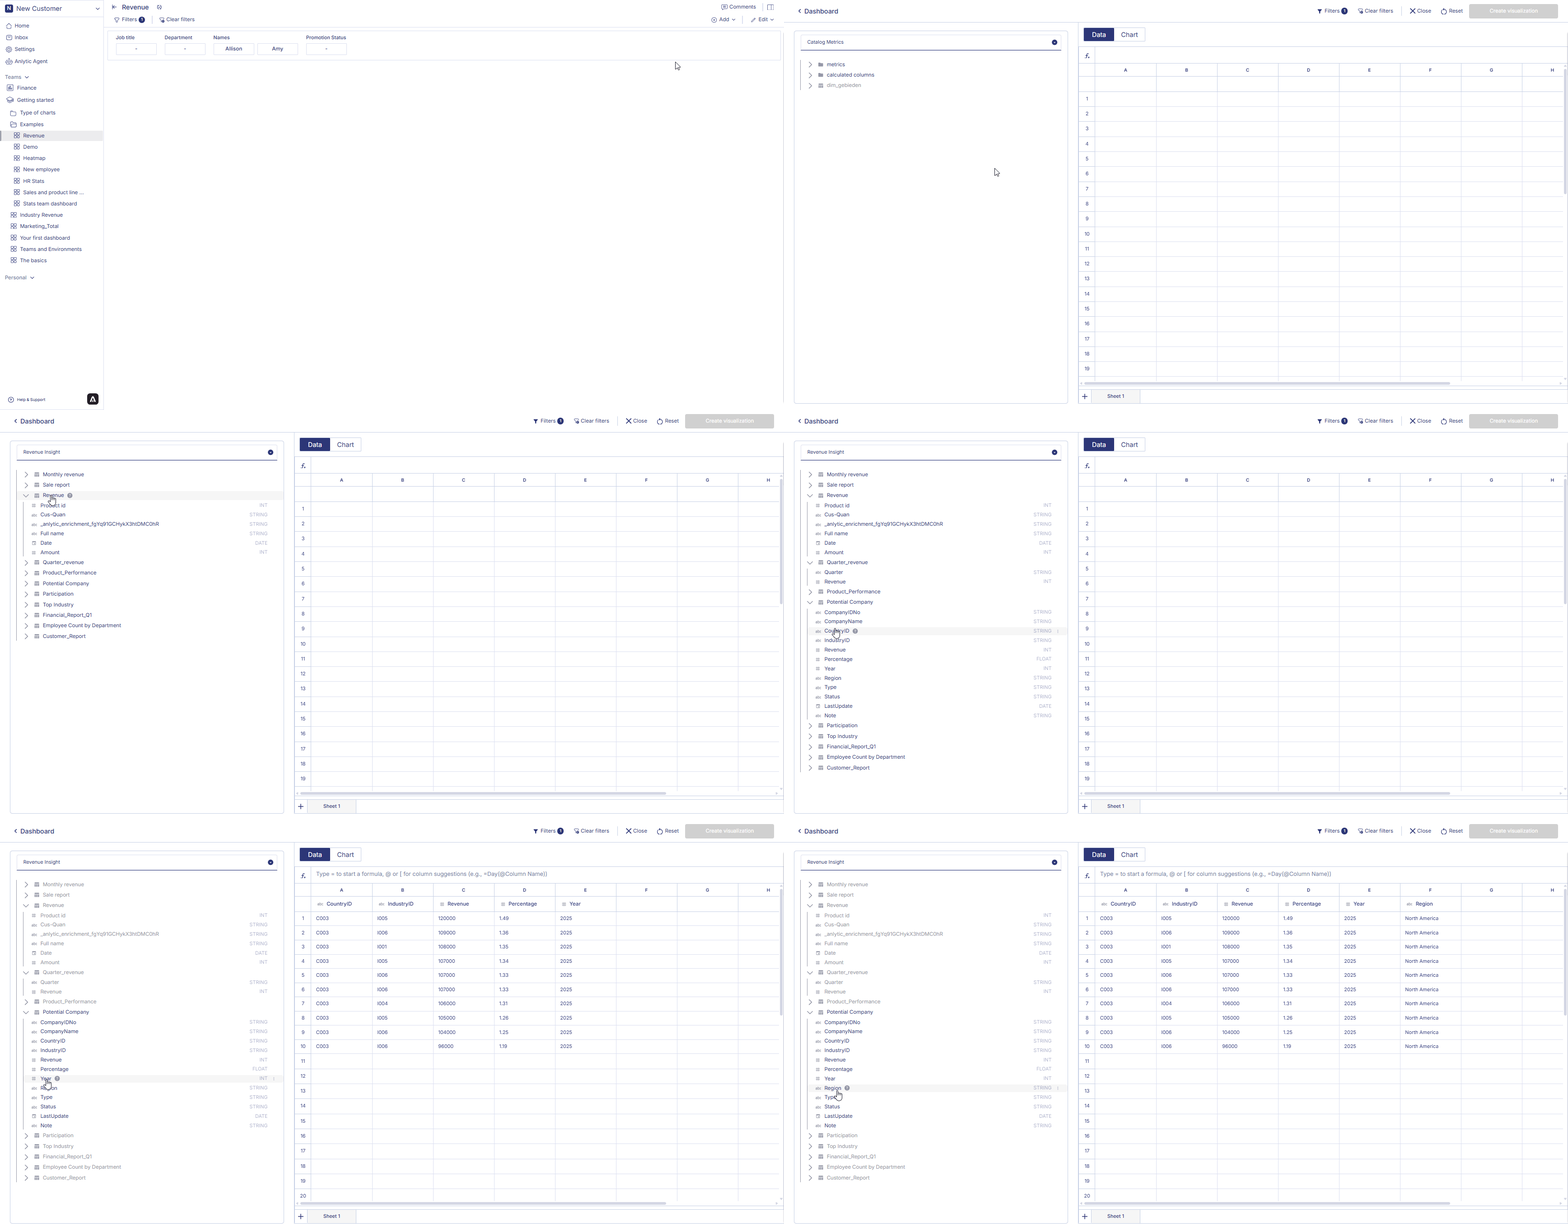 A new workbook is created or an existing one is reused.
### 1.2 Adding Data to the Workbook
1. The left panel displays your **catalog**.
2. Select a table.
3. Double-click columns to add them.
4. Columns appear in the **Workbook datasheet**.
5. You may add fields across multiple tables.
6. Joins are handled automatically based on catalog-defined relationships.
## 2. Managing Workbook Data
The workbook provides tools for preparing and transforming your dataset.
### 2.1 Managing Multiple Sheets
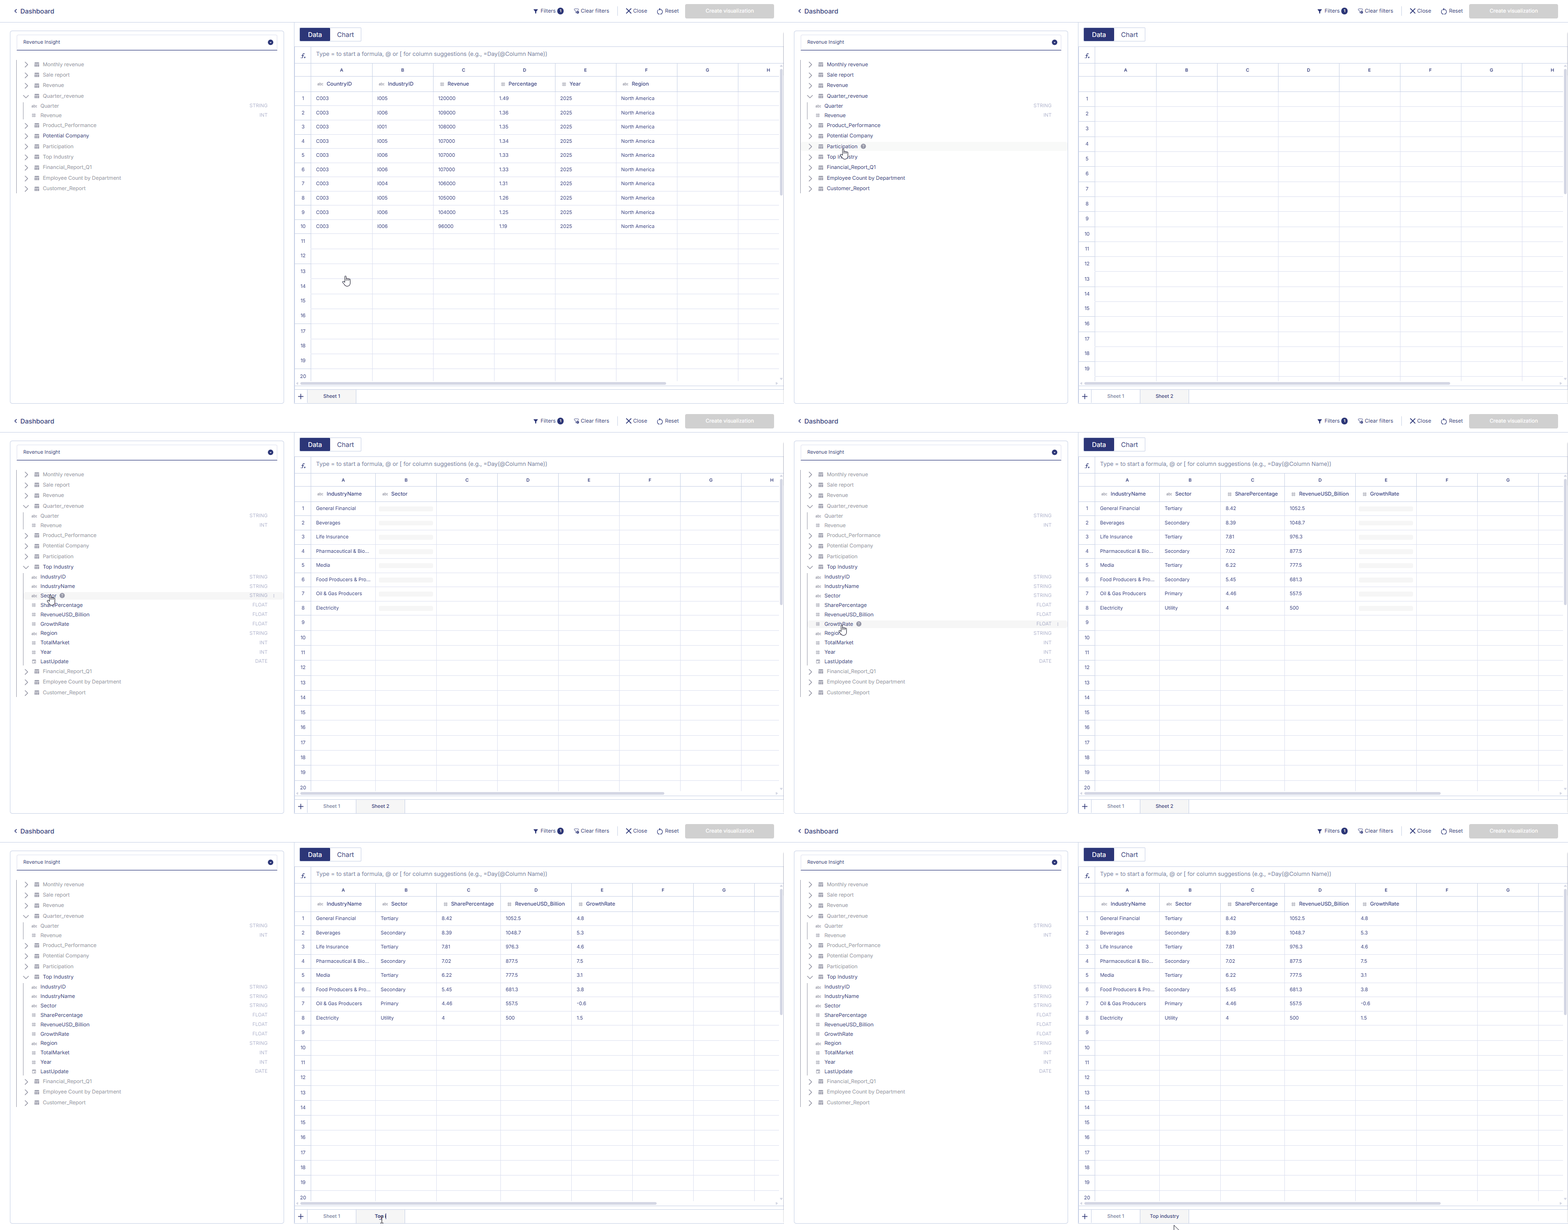
Workbooks can contain multiple datasheets, allowing you to organize, transform, or separate datasets within the same workbook.\
Multiple sheets can also be used to support multiple charts in the same dashboard. Each chart can reference a different sheet depending on the data it needs.
### Managing Sheets in a Workbook
* **Create a new sheet:** Click the **“+”** icon located at the bottom-left corner of the workbook.
* **Rename a sheet:** Click the **sheet header** you want to rename, then select **Rename sheet** from the menu.
* **Delete a sheet:** Click the **sheet header** you want to remove, then select **Delete**.
A new workbook is created or an existing one is reused.
### 1.2 Adding Data to the Workbook
1. The left panel displays your **catalog**.
2. Select a table.
3. Double-click columns to add them.
4. Columns appear in the **Workbook datasheet**.
5. You may add fields across multiple tables.
6. Joins are handled automatically based on catalog-defined relationships.
## 2. Managing Workbook Data
The workbook provides tools for preparing and transforming your dataset.
### 2.1 Managing Multiple Sheets
Workbooks can contain multiple datasheets, allowing you to organize, transform, or separate datasets within the same workbook.\
Multiple sheets can also be used to support multiple charts in the same dashboard. Each chart can reference a different sheet depending on the data it needs.
### Managing Sheets in a Workbook
* **Create a new sheet:** Click the **“+”** icon located at the bottom-left corner of the workbook.
* **Rename a sheet:** Click the **sheet header** you want to rename, then select **Rename sheet** from the menu.
* **Delete a sheet:** Click the **sheet header** you want to remove, then select **Delete**.
 ### 2.2 Renaming Column Header
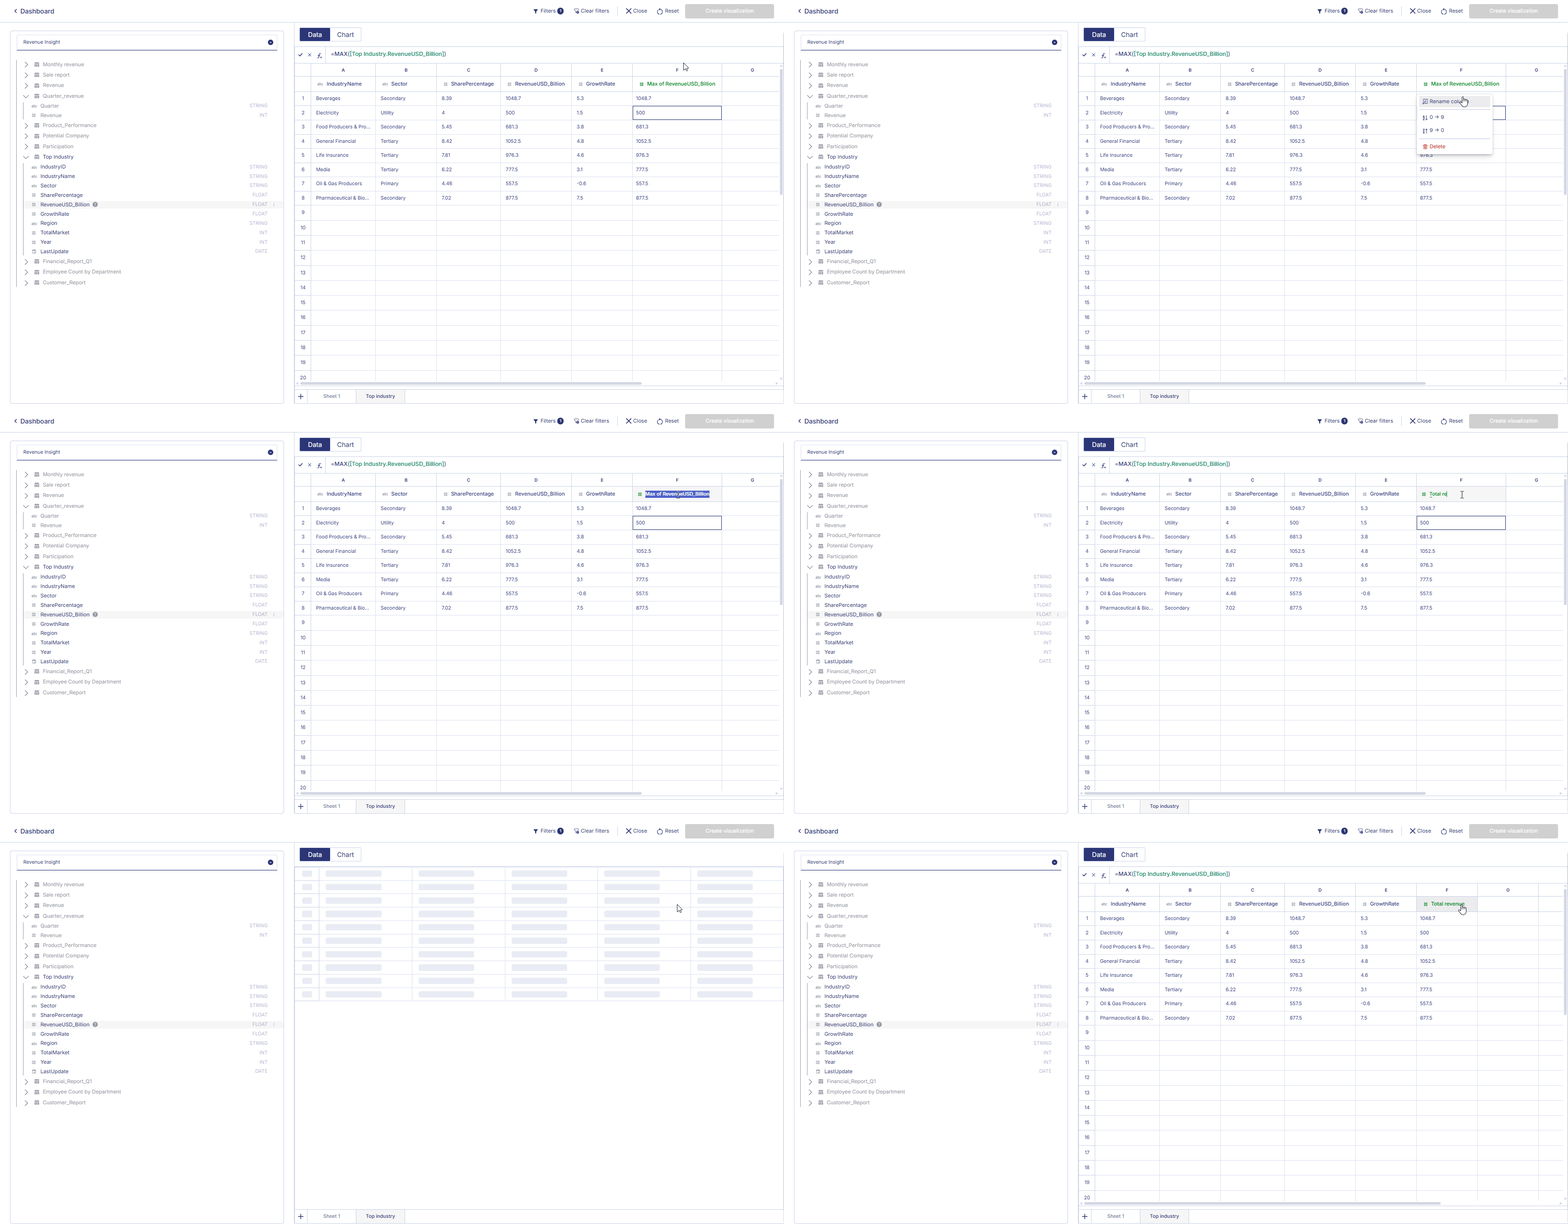
1. Click a column header.
2. Select **Rename column**.
3. Enter the new name.
Useful for business-friendly labels.
### 2.2 Renaming Column Header
1. Click a column header.
2. Select **Rename column**.
3. Enter the new name.
Useful for business-friendly labels.
 ### 2.3 Applying Filters
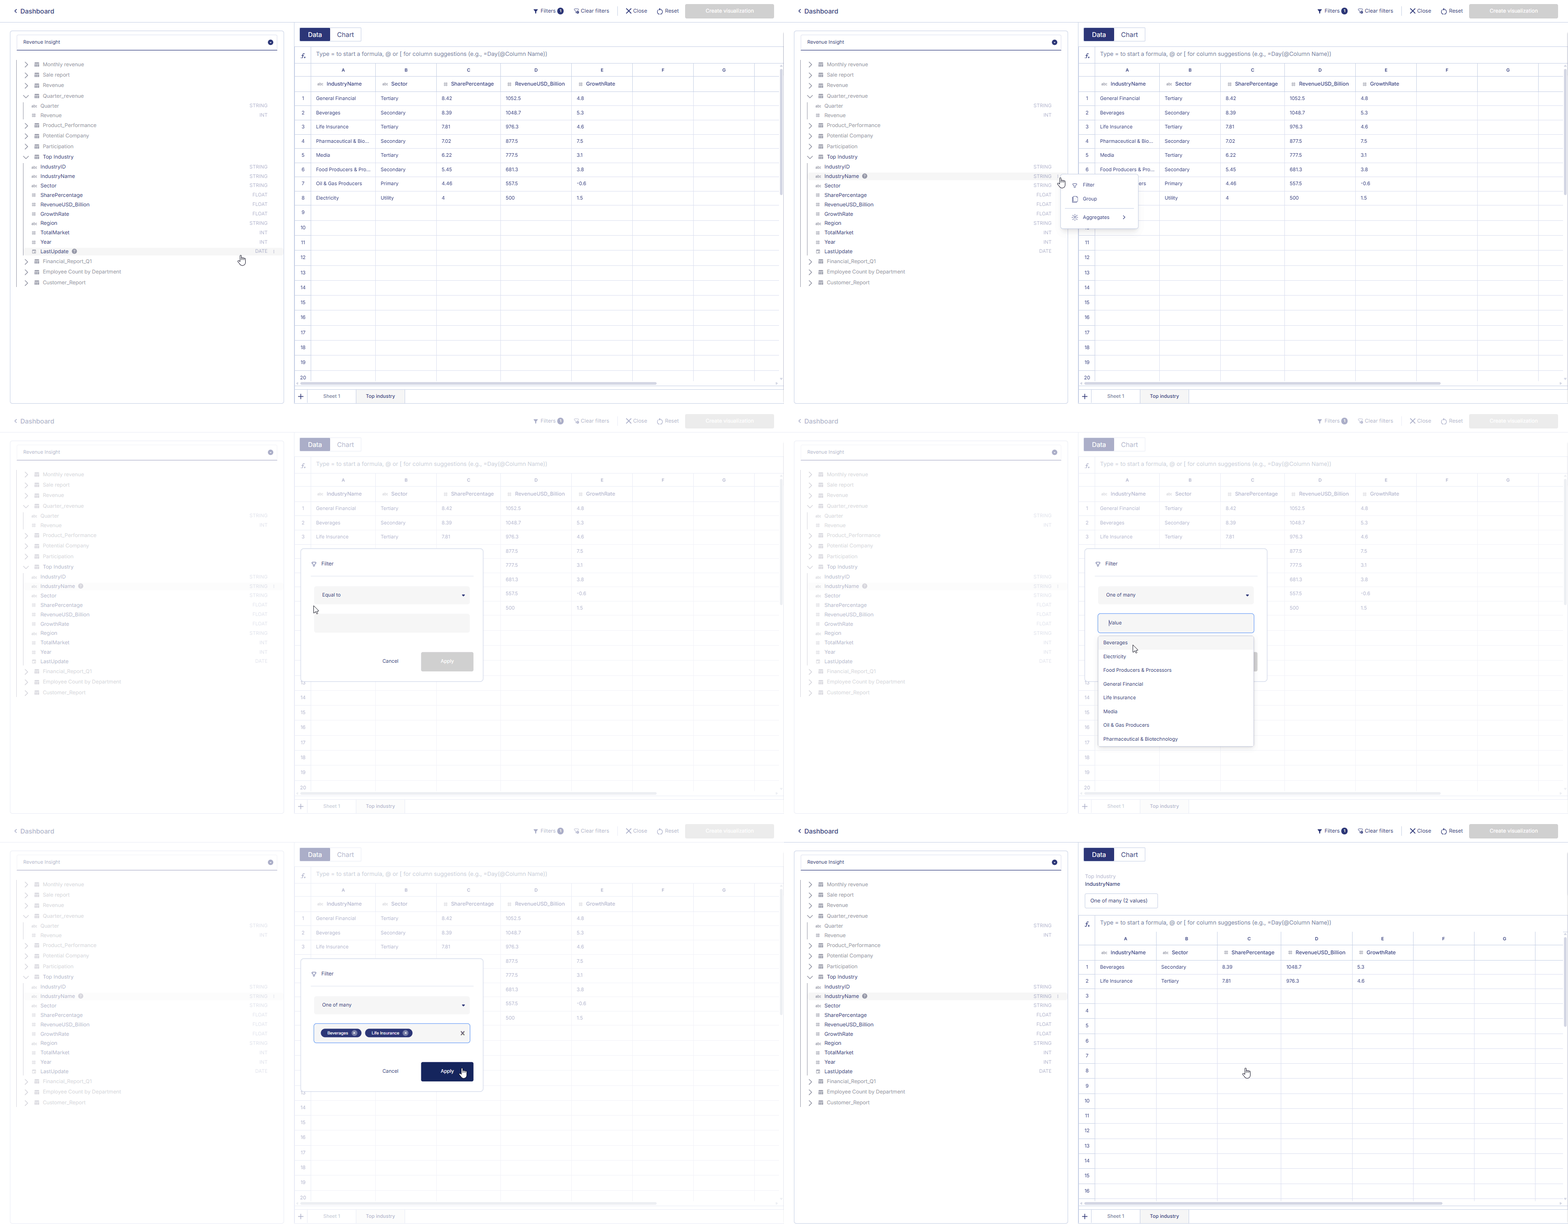
Filters limit your dataset to specific conditions.
1. Click the **filter icon** on a column.
2. Select a filter type:
* Equals / Not equal
* Contains / Starts with / Ends with
* Greater / Less than
* Date filters
3. Enter the value → click **Apply**.
Filters update the datasheet instantly and apply to visualizations.
### 2.3 Applying Filters
Filters limit your dataset to specific conditions.
1. Click the **filter icon** on a column.
2. Select a filter type:
* Equals / Not equal
* Contains / Starts with / Ends with
* Greater / Less than
* Date filters
3. Enter the value → click **Apply**.
Filters update the datasheet instantly and apply to visualizations.
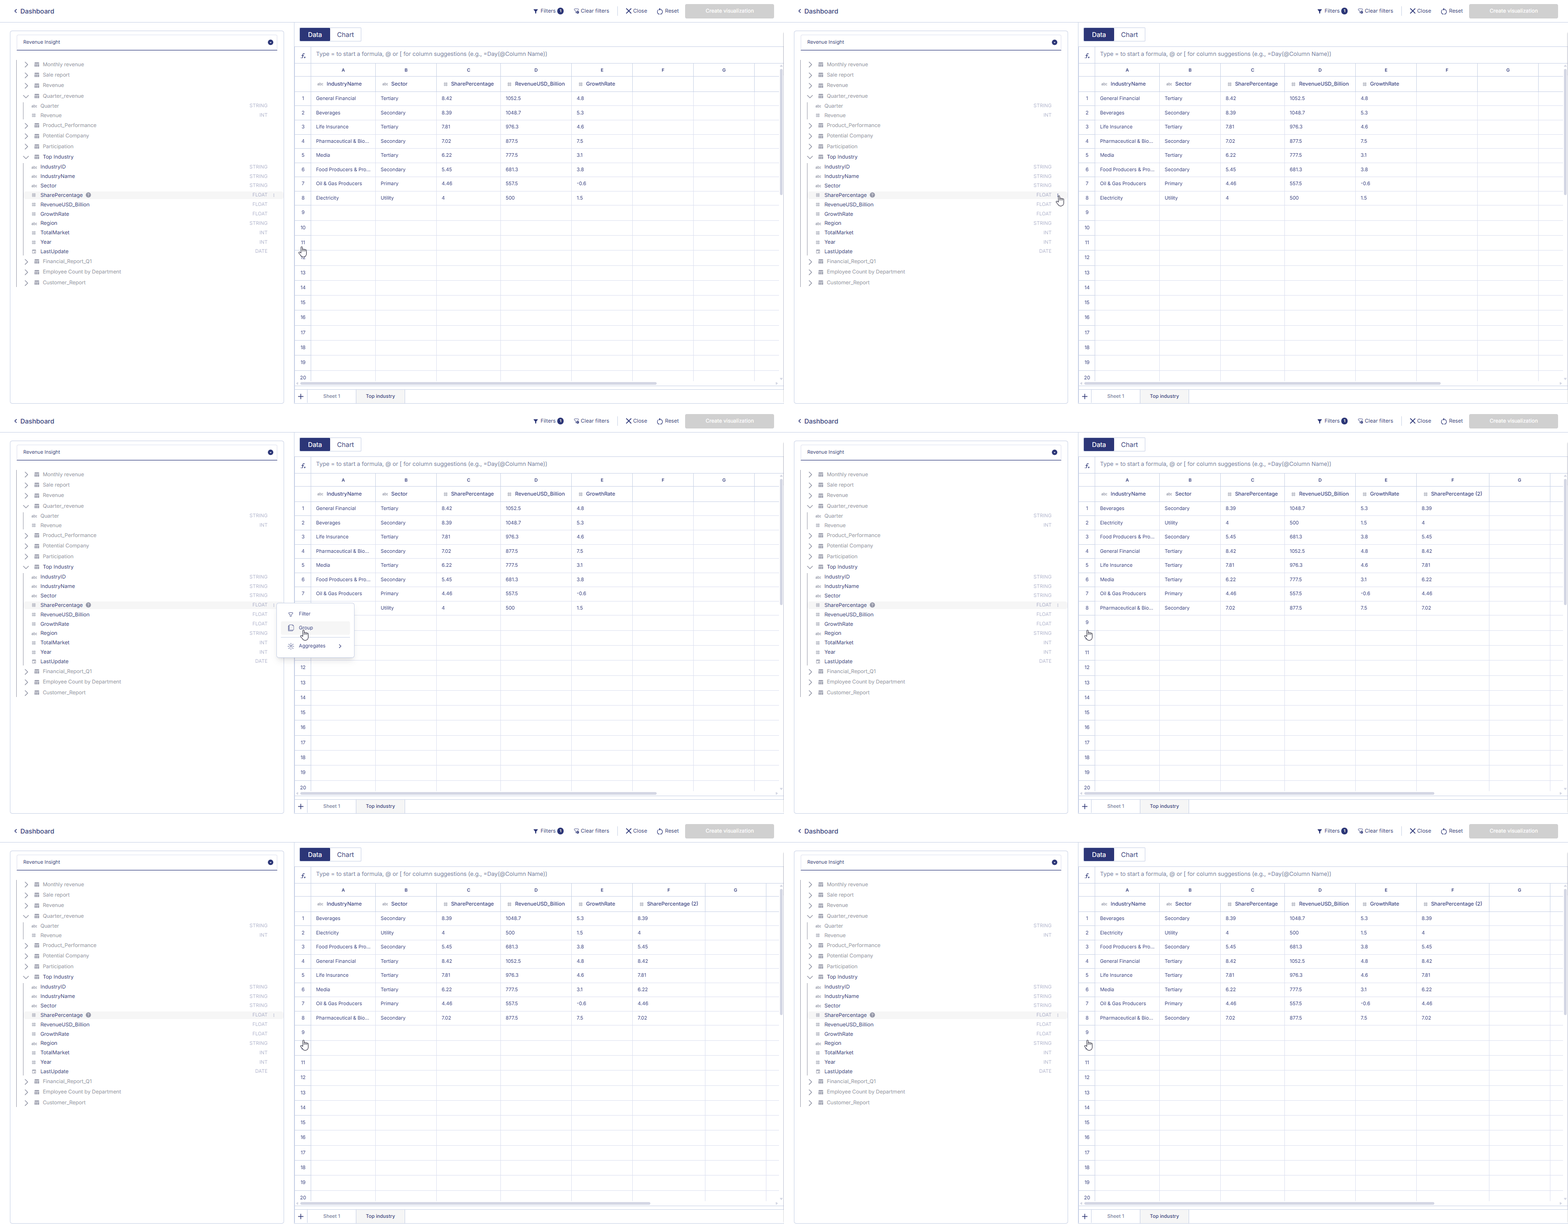
 ### 2.4 Grouping Data
Grouping organizes rows into summary buckets.
1. Click the column header.
2. Select **Group by this column**.
Multiple groupings are supported (e.g., Region + Category + Year).
Common uses: Heatmaps, Bar charts, Pivot tables,...
### 2.4 Grouping Data
Grouping organizes rows into summary buckets.
1. Click the column header.
2. Select **Group by this column**.
Multiple groupings are supported (e.g., Region + Category + Year).
Common uses: Heatmaps, Bar charts, Pivot tables,...
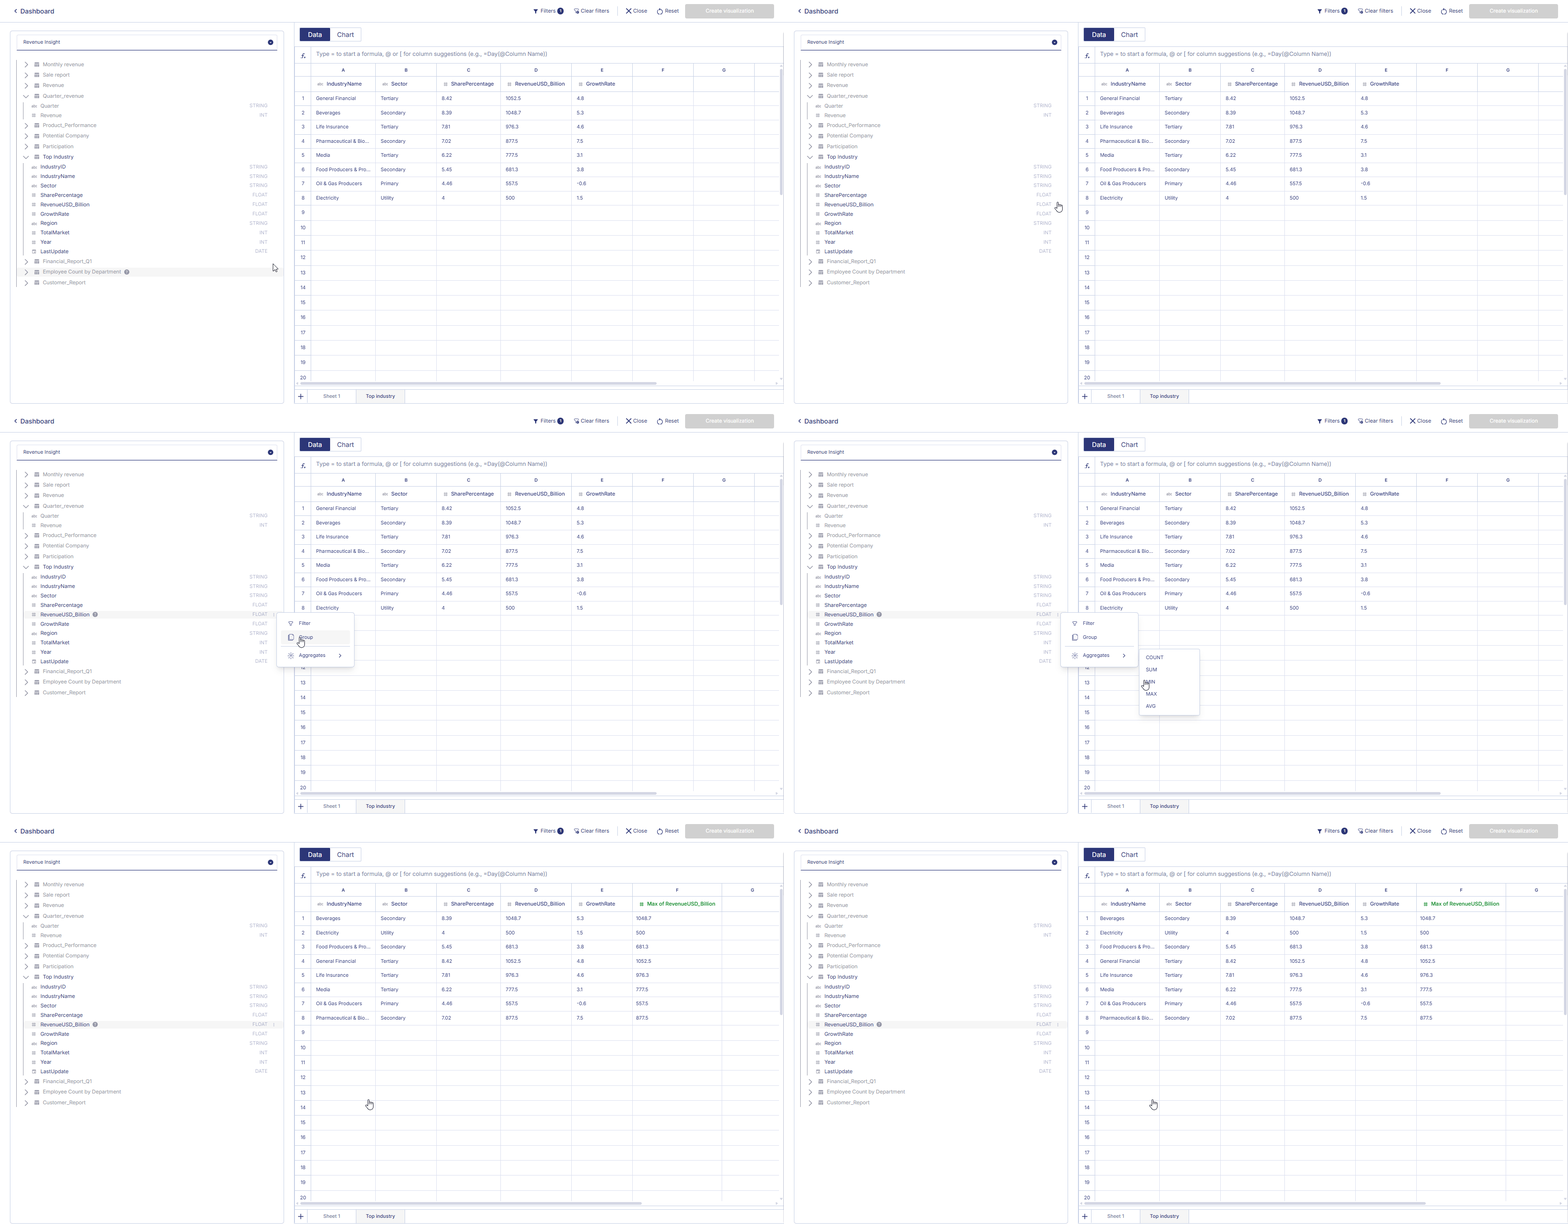
 ### 2.5 Aggregation
Aggregation reduces detailed rows into summarized values.
1. Click the **⋮** menu on a numeric column.
2. Choose an aggregation: Count, Sum, Avg, Min, Max
Results appear instantly.
### 2.5 Aggregation
Aggregation reduces detailed rows into summarized values.
1. Click the **⋮** menu on a numeric column.
2. Choose an aggregation: Count, Sum, Avg, Min, Max
Results appear instantly.
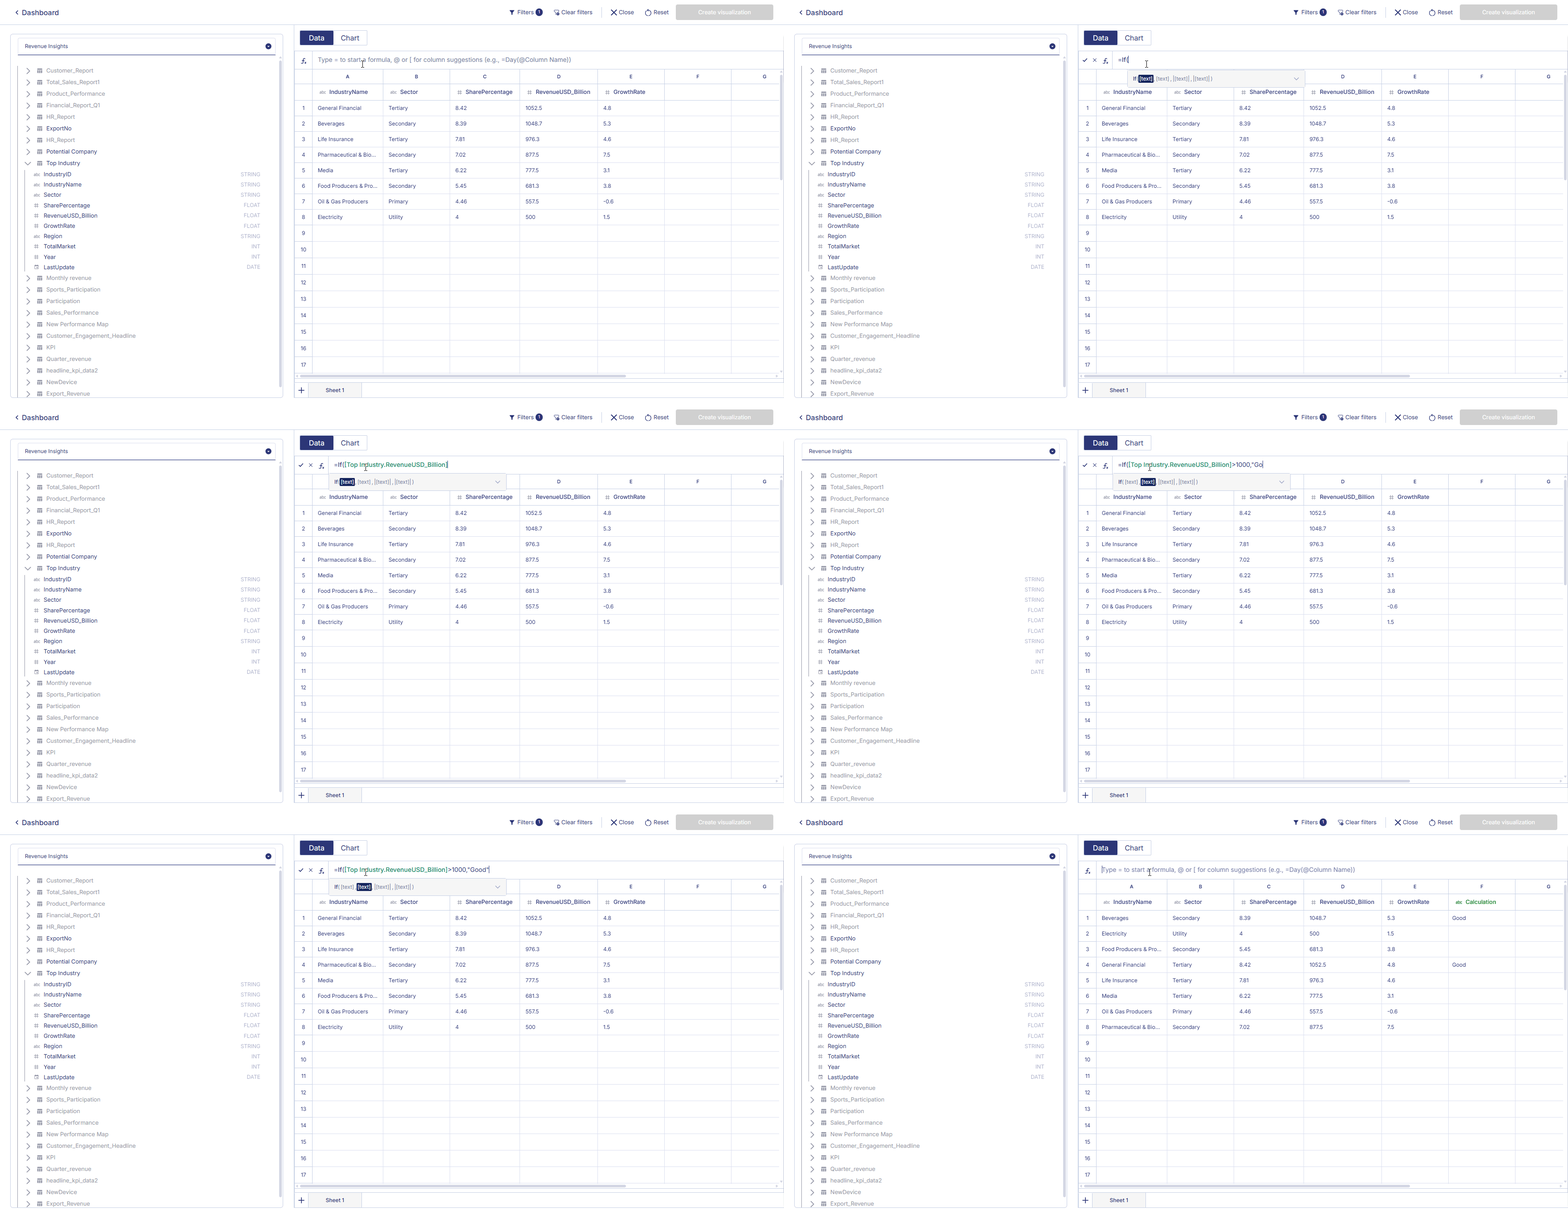
 ### 2.6 Support Functions in Workbook
Workbooks support formulas for advanced data transformations.
#### Mathematical: `ABS()`, `ROUND()`, `CEILING()`, `FLOOR()`, `POWER()`
#### Text: `CONCAT()`, `LOWER()`, `UPPER()`, `LEFT()`, `RIGHT()`
#### Date/Time: `DATE()`, `YEAR()`, `MONTH()`, `DAY()`,...
### 2.6 Support Functions in Workbook
Workbooks support formulas for advanced data transformations.
#### Mathematical: `ABS()`, `ROUND()`, `CEILING()`, `FLOOR()`, `POWER()`
#### Text: `CONCAT()`, `LOWER()`, `UPPER()`, `LEFT()`, `RIGHT()`
#### Date/Time: `DATE()`, `YEAR()`, `MONTH()`, `DAY()`,...
 Your workbook is now fully prepared for analysis and visualization.\
After shaping your dataset, organizing multiple sheets, applying filters, and performing transformations, you can begin building charts directly on top of the workbook.
Your workbook is now fully prepared for analysis and visualization.\
After shaping your dataset, organizing multiple sheets, applying filters, and performing transformations, you can begin building charts directly on top of the workbook.