> ## Documentation Index
> Fetch the complete documentation index at: https://docs.anlytic.com/llms.txt
> Use this file to discover all available pages before exploring further.
# Data table
In this chapter we are going to walk you through how you can create a data table using the Anlytic platform.
## How to create a data table?
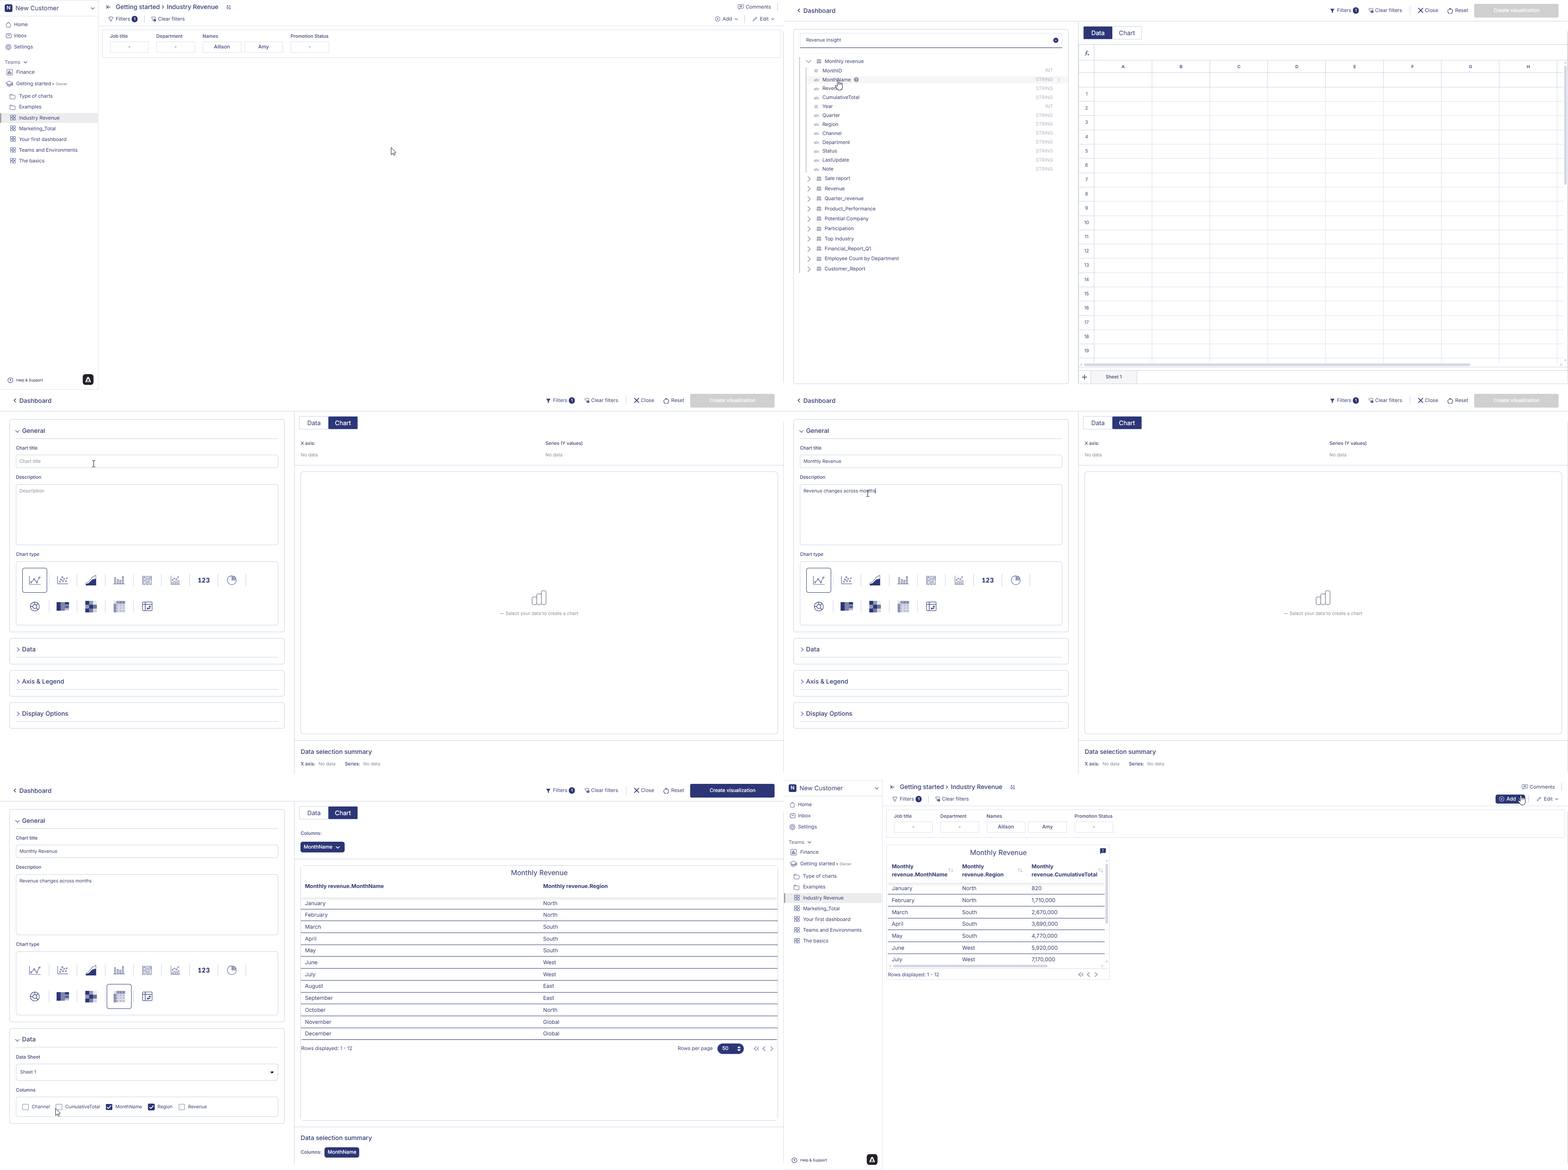
1. Choose a dashboard from the sidebar and switch to edit mode. Add a row, then add a visualization container to your dashboard. Select data visualization and click Create to open the visualization page.
2. Click Chart to configure your visualization. In the General section, set the chart title and description and choose data table as the chart type.
3. In the Data section, choose the data sheet and select the columns you want to display in the table. The data table will show the selected fields in the order they are chosen.
4. When you finish configuring the chart, click Create visualization in the top-right corner of the page. Your data table will be saved and displayed on the dashboard.
 ## How to edit a data table?
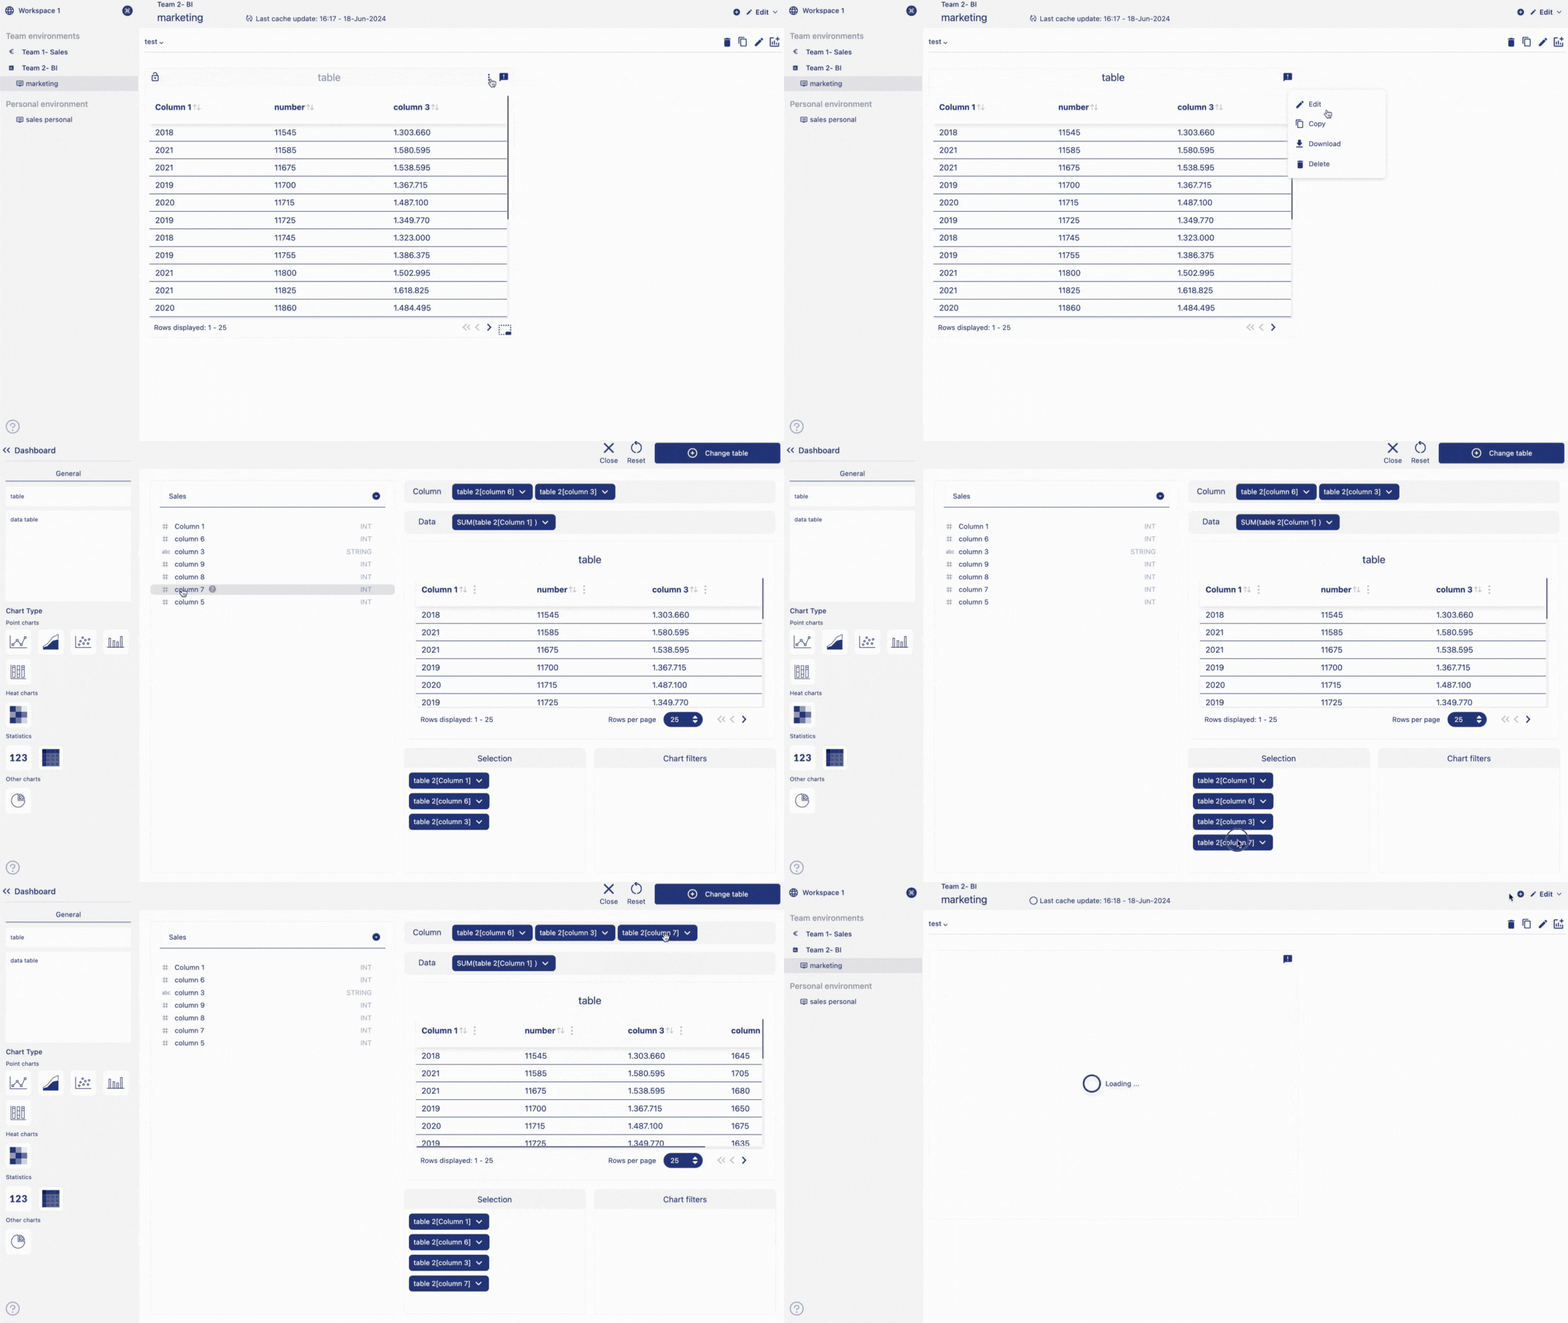
1. Hover of the title of the table container. Click on 'Edit' from the option menu.
2. Make changes to your table according to your need and click on 'change table' button to save your changes.
## How to edit a data table?
1. Hover of the title of the table container. Click on 'Edit' from the option menu.
2. Make changes to your table according to your need and click on 'change table' button to save your changes.
](https://mintlify.s3.us-west-1.amazonaws.com/anlytic/Resources/edit%20data%20table.gif) ## How to delete a data table?
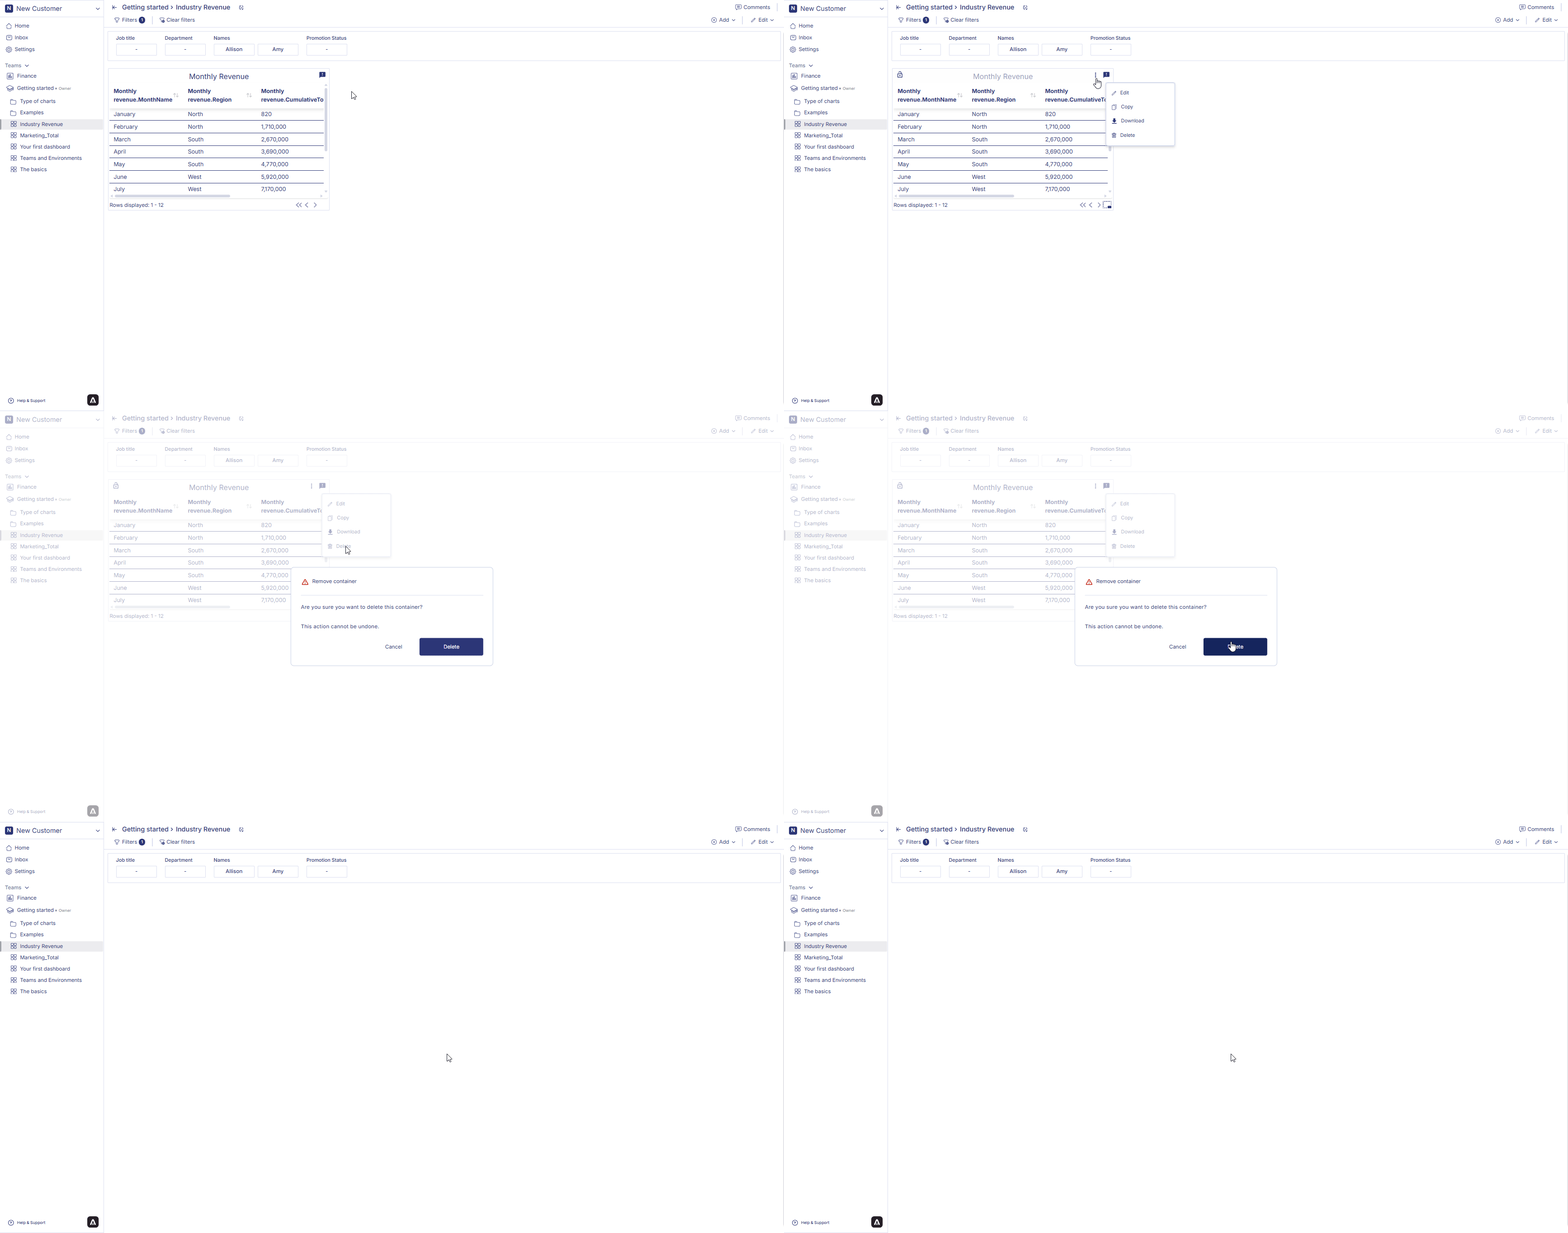
Hover of the title of the table container. Click on 'Delete' from the option menu. Click on 'Delete' to confirm your choice. Your table will be permanently deleted.
## How to delete a data table?
Hover of the title of the table container. Click on 'Delete' from the option menu. Click on 'Delete' to confirm your choice. Your table will be permanently deleted.
 In next page we are going to walk you through how you can create a [pivot table](pivottable) in the Anlytic platform.